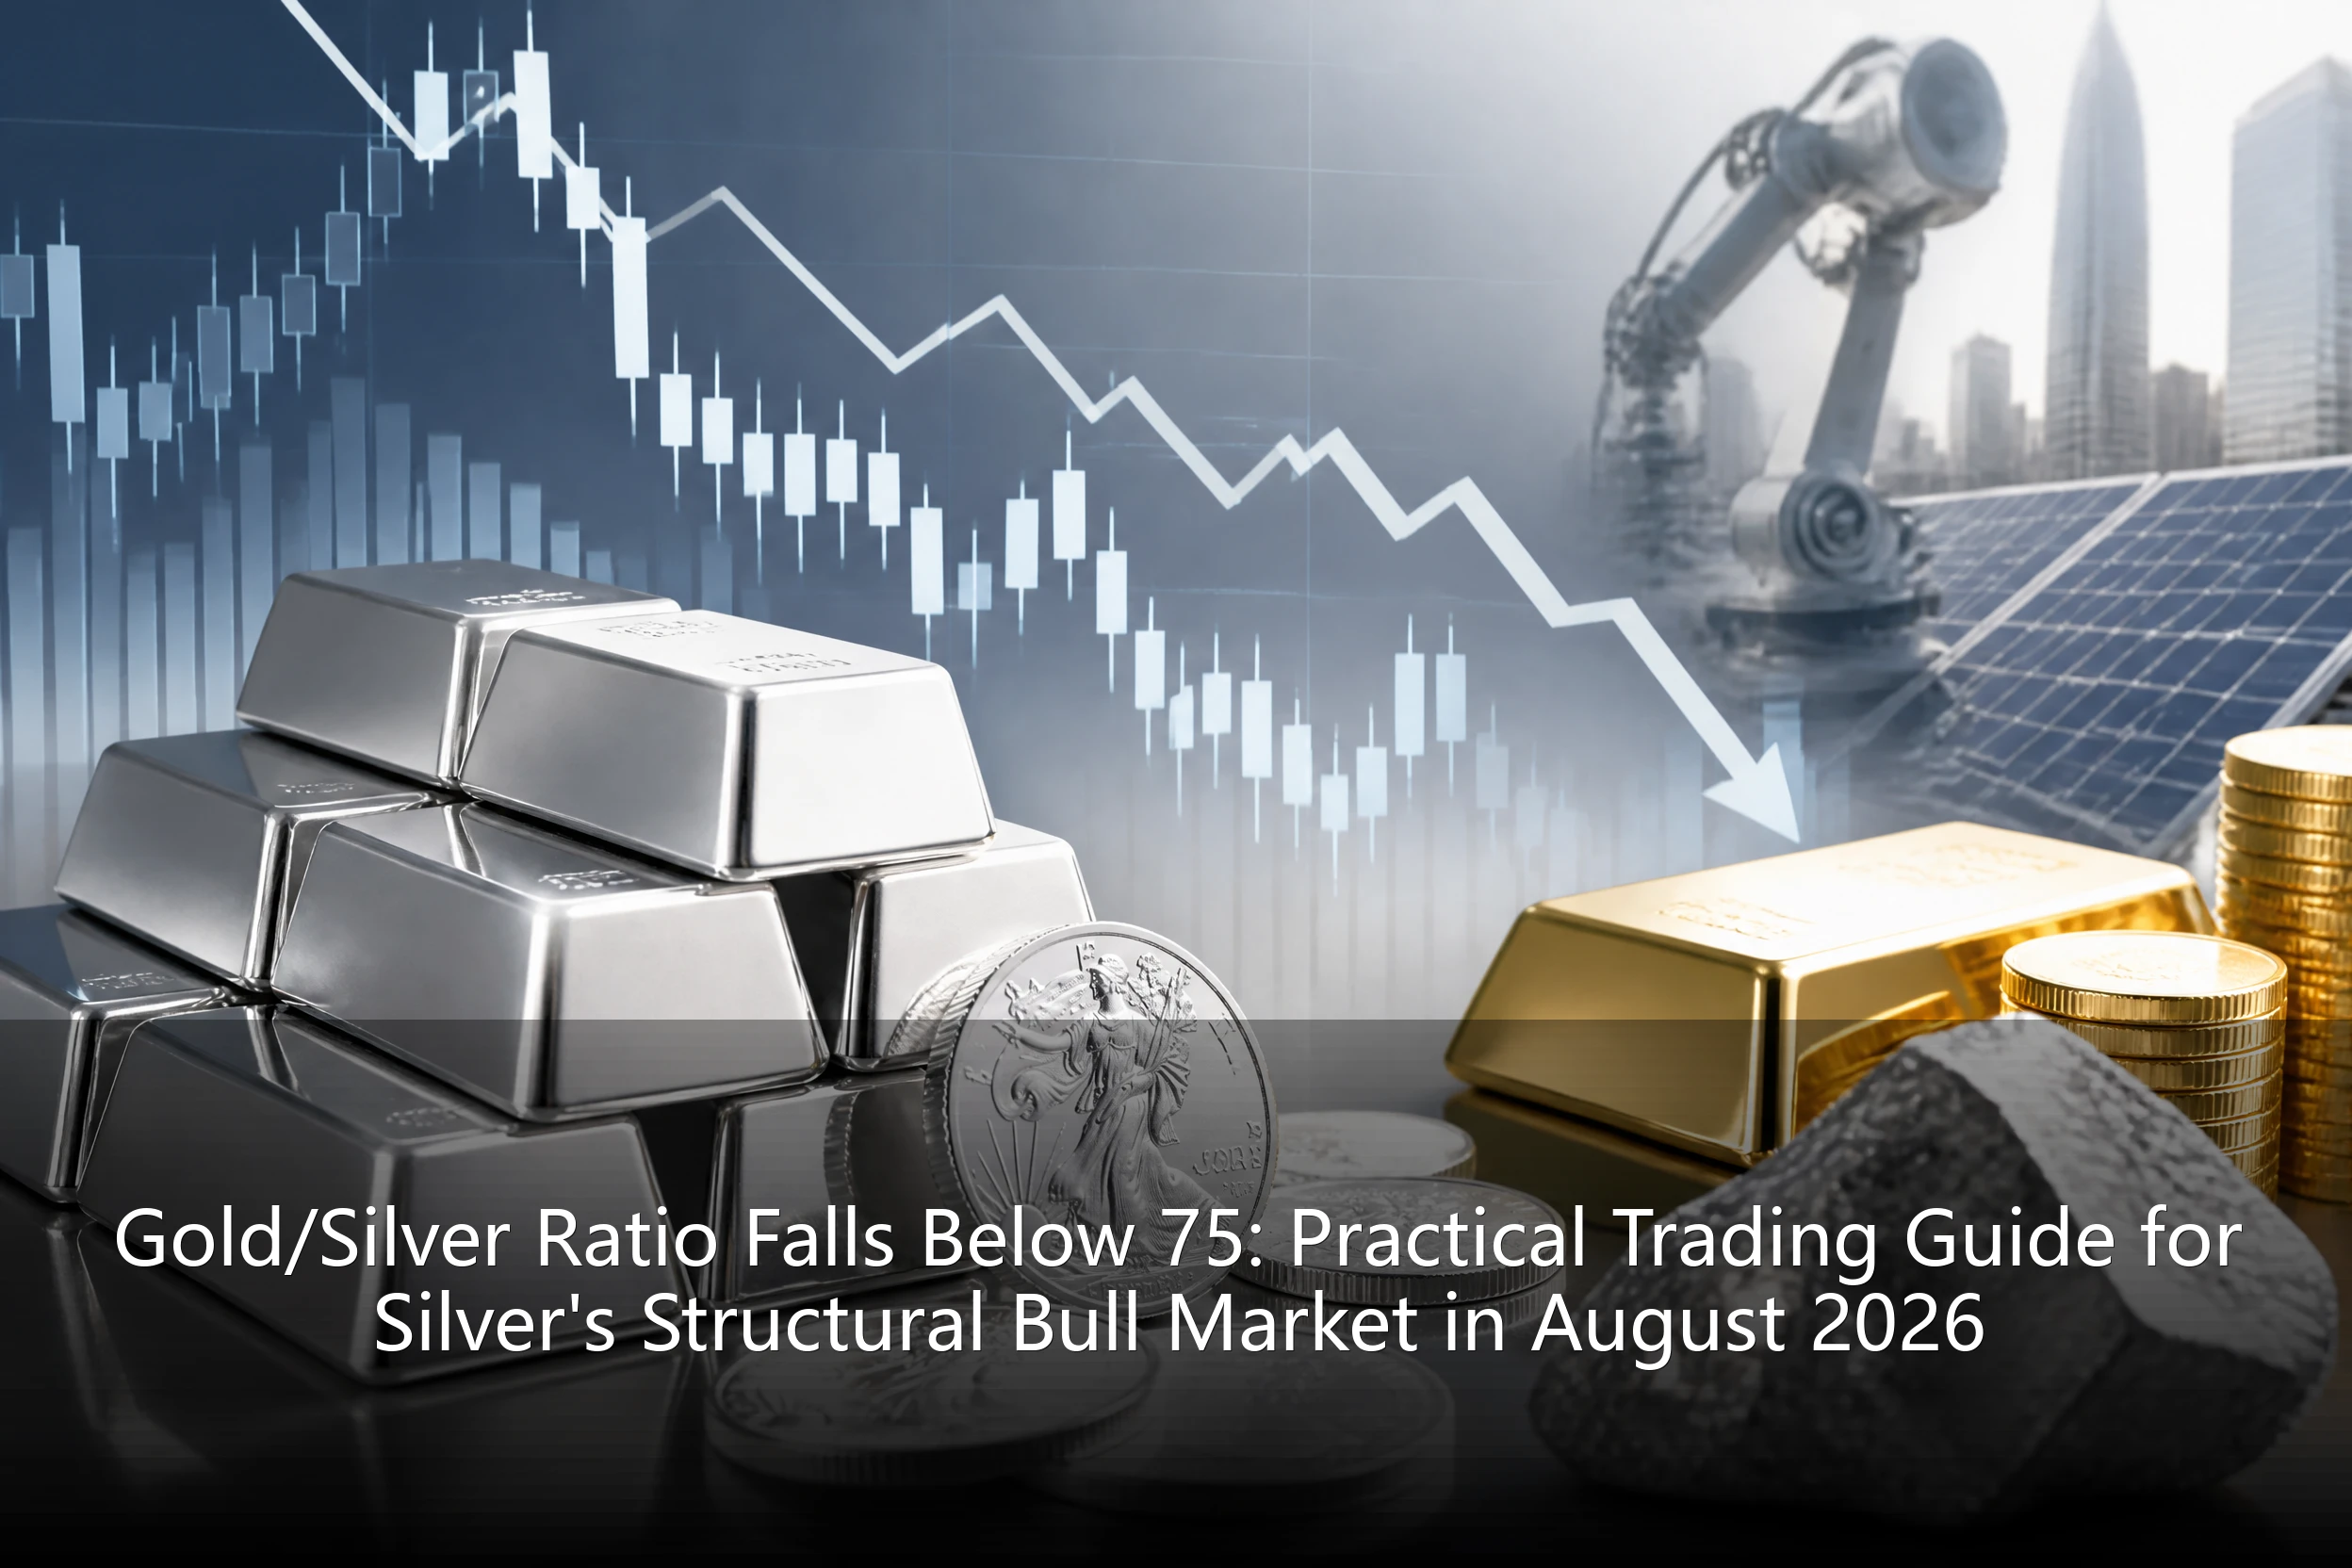
In August 2026, the global precious metals market is undergoing a profound structural rotation. As U.S. economic data presents a complex mix of hot and cold, gold prices are fluctuating widely near historical highs, while silver, leveraging its unique dual "financial + industrial" attributes, has staged an impressive independent rally. One of the most striking market signals is the sustained decline of the gold/silver ratio, breaking below the 75 mark. For "practical gold-panning" investors, this is not merely a numerical change, but a crucial anchor for shifting asset allocation logic and trading strategies. This article will combine the current macro backdrop to deeply analyze the drivers behind the gold/silver ratio's reversion and provide you with an actionable practical trading guide.
I. Gold/Silver Ratio Breaks Below 75: Not Just a Number, but a Signal of Macro Cycle Shift
The gold/silver ratio refers to the ratio of the price of one ounce of gold to one ounce of silver. Historically, because gold has stronger monetary attributes while silver has heavier industrial attributes, the ratio tends to spike to 80 or even above 100 during economic recessions or periods of extreme risk aversion; whereas during expansionary cycles of economic recovery or rising inflation expectations, the ratio tends to fall back to the 60-70 range. In August 2026, this ratio breaking below 75 signals that the market is re-evaluating silver's intrinsic value.
1. Industrial Demand Builds a Solid Bottom Support for Silver
From a fundamental perspective, silver's industrial demand remained robust throughout 2026. As the global energy transition enters a critical phase, the photovoltaic industry's demand for silver paste is growing exponentially. Additionally, the construction boom of AI data centers has driven up the demand for highly conductive metal materials, and silver's irreplaceability in electronic components keeps depleting its inventory. According to industry tracking data, silver inventories in major global exchanges have dropped to lows not seen in recent years. This "physical tightness" has built a solid bottom for silver prices.
2. Dual Resonance of Safe-Haven Sentiment and Inflation Expectations
On the financial attribute side, high U.S. fiscal deficits and geopolitical uncertainties continue to boost market safe-haven sentiment. However, unlike gold, silver is more sensitive to inflation expectations. When the market anticipates the U.S. economy might fall into a "stagflation" quagmire, silver can benefit from safe-haven buying while also being sought after as an anti-inflation asset. This dual resonance is the core logic behind silver's recent gains significantly outperforming gold.
II. Practical Analysis: How to Use the Gold/Silver Ratio for Cross-Variety Arbitrage and Directional Long
For practical traders, the deviation and reversion of the gold/silver ratio provides abundant trading opportunities. Understanding and applying these strategies is key to improving trading efficiency.
1. Cross-Variety Arbitrage Strategy (Pairs Trading)
When the gold/silver ratio significantly deviates from its historical mean, arbitrage opportunities arise. With the ratio currently below 75, if it is judged that there is still room for further downside (i.e., silver will continue to outperform gold), a hedging arbitrage strategy of "long silver, short gold" can be employed in practice.
- Position Allocation: To achieve market neutrality, capital allocation needs to be weighted based on the volatility of both. Typically, gold's volatility is lower than silver's, so relatively more capital needs to be allocated to the short gold leg to balance the high volatility risk on the silver leg.
- Entry/Exit Logic: Entry timing can reference the RSI indicator or Bollinger Bands. When the daily chart of the gold/silver ratio shows overbought signs and touches the upper Bollinger Band, an arbitrage position can be established; when the ratio falls back to the historical median (e.g., the 65-70 range) or touches the lower Bollinger Band, take profit.
- Risk Control: Arbitrage is not risk-free. If an extreme black swan event occurs in the market (such as a sudden liquidity crisis), gold might surge due to a safe-haven premium, causing the gold/silver ratio to spike briefly. Therefore, setting a maximum loss stop-loss line of 8%-10% is a necessary defensive measure.
2. Trend-Following Strategy for Directional Long Silver
For investors who prefer unilateral trading, silver's current strong breakout provides a good window for going long. However, silver is known as the "devil's metal," and its high volatility requires traders to maintain strict discipline.
- Breakout Following Method: Taking the August 2026 market as an example, silver often accompanies a wave of accelerated gains after breaking through previous platform highs. In practice, you can follow up when the price breaks through a key resistance level and holds above it for more than three trading days, with the stop-loss set at 5% below the breakout point.
- Moving Average System Support: In a strong trend, the 20-day Exponential Moving Average (EMA) is usually an excellent dynamic support level. When the silver price pulls back to near the 20EMA and a bullish candlestick pattern appears (such as a hammer or engulfing pattern), it is a high-win-rate opportunity to add to or enter a position.
III. Position Management and Risk Hedging: The Survival Rules for Practical Traders
In the precious metals market, surviving long is more important than making money fast. Facing silver's high volatility, scientific position management is the core of practical trading.
1. Pyramid Position Building Method
After confirming silver's medium-term bull market pattern, avoid going all-in at once. It is recommended to adopt pyramid position building: control the initial position to 20% of total capital, and as the price moves in the expected direction, add positions sequentially at 15%, 10%, and 5% after pullbacks confirm support is effective. This averages out costs and avoids taking excessive losses during false breakouts. Once the market reverses, because the bottom positions are the heaviest and the top positions are the lightest, the overall loss when stopping out can be effectively controlled.
2. Using Options for Tail Risk Hedging
For investors holding large amounts of physical silver or long futures positions, facing macro risks such as sudden shifts in Federal Reserve policy, buying out-of-the-money put options is an excellent insurance strategy. Although this incurs a certain premium cost, in the event of violent market fluctuations, the non-linear payoff characteristic of options can effectively hedge against huge drawdowns on the spot end, allowing investors to maintain psychological stability during severe turbulence.
3. Pay Attention to the Inverse Anchoring of the Dollar Index and U.S. Treasury Yields
In practice, you cannot just stare at the charts; you must use the U.S. Dollar Index (DXY) and the 10-year U.S. Treasury yield as auxiliary reference indicators. Typically, silver is negatively correlated with the dollar. If you find the dollar index strengthening but silver refusing to fall, this is usually an extremely strong bullish signal, indicating that underlying industrial demand or safe-haven buying is sufficient to counter macro headwinds. At this point, you should firmly hold long positions.
IV. Specific Operational Guidelines Under the Current Market Environment
Standing at the point of August 2026, combining the performance of U.S. economic data and the Federal Reserve's policy tone, we have outlined the following practical key points for investors:
- Short-term (1-2 weeks): Focus on the release of U.S. inflation data (CPI/PCE). If inflation data exceeds expectations, it will reinforce silver's anti-inflation logic, and you can go short-term long. The target can be set above the recent high, with the stop-loss closely trailing the low before the data release.
- Medium-term (1-3 months): Buy silver futures or related ETFs on dips. With the potential recovery in global manufacturing PMI, silver's industrial demand will enter a peak season. It is recommended to build silver positions in batches when the gold/silver ratio rebounds to the 75-78 range, waiting to profit from the ratio's subsequent decline.
- Long-term allocation: For asset allocation-oriented investors, the proportion of physical silver or silver trusts in total assets can be increased to 5%-10%, serving as a strategic bottom position to hedge against fiat currency depreciation and energy transition dividends.
Conclusion: Finding Certainty in Volatility
The precious metals market is always volatile, and volatility itself is the source of profit. The decline of the gold/silver ratio in August 2026 is not only the prelude to silver's value revaluation but also a test of investors' practical trading abilities. As practical gold-panners, we must not only understand the underlying logic of the macroeconomy but also translate this logic into specific trading plans: when to enter, when to add positions, when to stop loss, and when to take profit. Only by combining rigorous strategic analysis with ironclad position management can one ride steady on the wild dark horse of silver, cross cycles, and achieve steady wealth appreciation. Ruihe Precious Metals will continue to track the dynamics of the U.S. gold and silver markets for you, providing cutting-edge practical strategies and data interpretation, accompanying you to go steady and far on the path of precious metals investment.